Stata is my favourite general-purpose stats package. Sadly, it is also one of my favourite pasttimes, but there you are. Here is my collection of Stata-related blog posts. If this is relevant for you, you might also be interested in a series of slides for a Stata course I taught some years ago (in German)
A year ago, I wrote a slightly maudlin blog about the good and the not-so-good reasons for solo-blogging in this time and age. Good reasons or not, I kept up the good work with 35 blogs in 2018. That is a bit less than my long-term annual average, but Chapeau to my good self nonetheless.
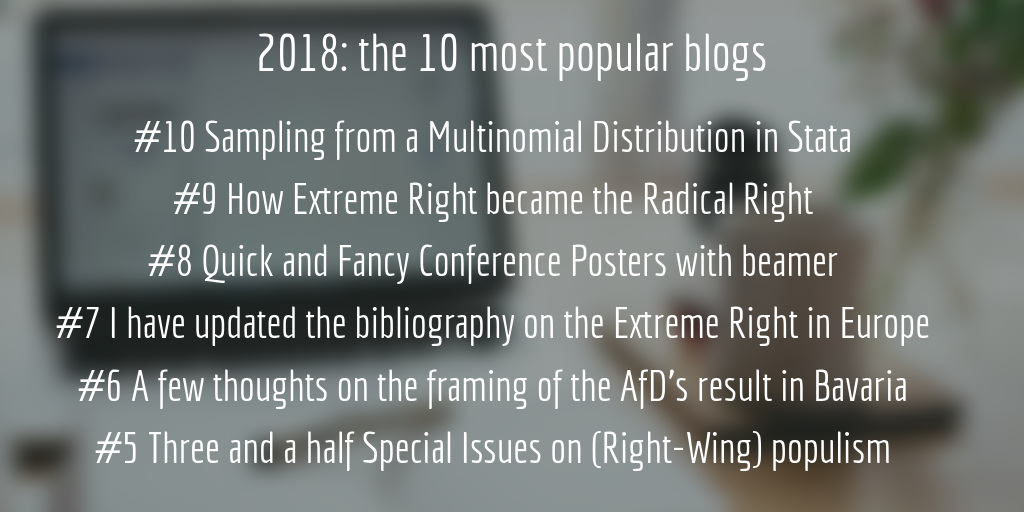
But what were the most popular (used in a strictly relative sense) posts on the blog in 2018? Here is your handy guide:
#10 Sampling from a Multinomial Distribution in Stata Who hasn’t found themselves in the situation where they want to sample from a multinomial distribution (IRONY KLAXON!)? It’s easily done in R. In Stata, you have to go through a few hoops. This short 2011 post is still reasonably popular, seven years down the line, because it tells you how you do it.
#6 A few thoughts on the framing of the AfD’s result in Bavaria In the Bavaria state election in October 2018, the AfD did actually less well than many had expected. But to the party’s immense delight, many journalists remained in full democratic-crisis mode. I disagree with that, for reasons.
#5 Three and a half Special Issues on (Right-Wing) populism. And then two more 2018 was a horrible year for the world, and hence a good year for Radical Right/Populism research. It showed early on, i.e. in January, with a number of special issues on the topic.
#4 I looked up the AfD’s women’s organisation on Facebook. You will not believe what I found. I wrote this one on December 30 2017. What can I say? Sometimes, reality imitates art. You will not believe it until you see what I saw.
This is not the late 1990s. Hey, it’s not even the early Naughties, and has not been for a while. I have had my own tiny corner of the Internet (then hosted on university Web space as it was the norm in the day) since Mosaic came under pressure from Netscape and the NYT experimented with releasing content as (I kid you not) postscript files, because PDF was not invented yet. I did this mostly because I liked computers, because it was new, and because it provided an excellent distraction from the things I should have been doing. By and large, not much changes over 25 years.
Photo by karimian
Later (that was before German universities had repositories or policies for such things), my webspace became a useful resource for teaching-related material. Reluctantly and with a certain resentment, I have copied slides and handouts from one site to the next, adding layers of disclaimers instead of leaving them behind, because some of this stuff carries hundreds of decade-old backlinks and gets downloaded / viewed dozens of times each day.
And of course, I started posting pre-publication versions of my papers, boldly ignoring / blissfully ignorant of the legal muddle surrounding the issue back in the day. Call me old fashioned, but making research visible and accessible is was the Web was invented for.
In summer 2008, I set up my own domain on a woefully underpowered shared webspace (since replaced by an underpowered virtual server). A bit earlier in the same year, already late to the party, I had started my own “Weblog” on wordpress.com, writing and ranting about science, politics, methods, and all that. A year down the road, I converted www.kai-arzheimer.com to wordpress, moved my blog over there, and have never looked back continously wondered why I kept doing this.
Why keep blogging?
In those days of old, we had trackbacks and pingbacks & stuff (now a distant memory), and social media was the idea of having a network of interlinking personal blogs, whose authors would comment on each other’s posts. Even back in 2008 on wordpress, my blog was not terribly popular, but for a couple of years, there was a bunch of people who had similar interests, with whom I would interact occasionally.
Then, academically minded multi-author blogs came along, which greatly reduced fragmentation and aimed at making social science accessible for a much bigger audience whilst removing the need to set up and maintain a site. For similar reasons, Facebook and particularly Twitter became perfect outlets for ranting “microblogging”, while Medium bypasses the fragmentation issue for longer texts and is far more aesthetically pleasing and faster than anything any of us could run by ourselves.
Photo by kjarrett
It is therefore only rational that many personal academic blogs died a slow death. People I used to read left Academia completely, gave up blogging, or moved on to the newer platforms. Do you remember blogrolls? No, you wouldn’t. Because I’m a dinosaur, I still get my news through an RSS reader (and you should, too). While there are a few exceptions (Chris Blattman and Andrew Gelman spring to mind), most of the sources in my “blog” drawer are run by collectives / institutions (the many LSE blogs, the Monkey Cage, the Duck etc.). I recently learned that I made it into an only slightly dubious looking list of the top 100 political science blogs, but that is surely because there are not many individual political science bloggers left. So why am I still rambling in this empty Platonic man-cave? Off the top of my head, I can think of about five reasons:
Total editorial control. I have written for the Monkey Cage, The Conversation, the LSE, and many other outlets. Working with their editors has made my texts much better, but sometimes I am not in the mood for clarity and accessibility. I want to rant, and be quick about it.
Pre-prints. I like to have pre-publication versions of my work on my site, although again, institutional hosting makes much more sense. Once I upload them, I’m usually so happy that I want to say something about it.
For me, my blog is still a bit like an open journal. If I need to remember some sequence of events in German or European politics for the day job, it’s helpful if I have blogged about it as it happened. Similarly, sometimes I work out the solution to some software issue but quickly forget the details. Five months later, a blog post is a handy reference and may help others.
Irrelevance. Often, something annoys or interests me so much that I need to write a short piece about it, although few other people will care. I would have a better chance of being of finding an audience at Medium, but then again on my own wordpress-powered site, I have a perfectly serviceable CME which happens to have blogging functionality built in.
Ease of use. I do almost all of my writing in Emacs and keep (almost) all my notes in orgmode code. Thanks to org2blog, turning a few paragraphs into a post is just some hard-to-remember key strokes away.
Bonus track: the five most popular posts in 2017
As everyone knows, I’m not obsessed with numbers, thank you very much. I keep switching between various types of analytic software and have no idea how much (or rather little) of an audience I actually have. Right now I’m back to the basic wordpress statistics and have been for over a year, so here is the list of the five posts that were the most popular in 2017.
#5 nlcom and the Delta Method. This is a short explainer of the Delta Method and its implementation in a Stata command. It was written in the summer of 2013, presumably when we were working on surveybias, as a note-to-future-self post. It was viewed 343 times in 2017. Not too shabby for an oldie.
#4 State of the German polls: The Schulz effect was real. Part of my 2017 poll-pooling exercise, this post demonstrates that the bounce for the SPD early in the campaign was real but short-lived. Just like this post? It got 620 views, but most of them (559) in March, right when it was published.
#3 Similarly, Five Quick takes on the German election was viewed 869 times, but almost exclusively on election night and on the following day. Which is a pity, because some of it is still relevant (I think).
#2 I looked up the AfD’s women’s organisation on Facebook. You will not believe what I found Posted only on December 30, this one got 878 views in the few remaining hours of the old year, almost bringing down my server in the process. Traffic was driven by Twitter, thanks to the click-baity title and the incredible image. You will not believe what I saw until you see it.
How can we usefully summarise the accuracy of an election opinion poll compared to the real result of an election? In this blog, we describe a score we have devised to allow people to see how different polls compare in their reflection of the final election result, no matter how many parties or candidates are standing. This index, B, can be compared across time, polling company and even election to provide a simple demonstration of how the polls depicted public opinion in the run-up to polling-day
Just how badly biased is your pre-election survey? Once the election results are in, our scalar measures B and B_w provide convenient, single number summaries. Our surveybias add-on for Stata will calculate these and other measures from either raw data or from published margins. Its latest iteration (version 1.4) has just appeared on SSC. Surveybias 1.4 improves on the previous version by ditching the last remnants of the old numerical approximation code for calculating standard errors and is hence much faster in many applications. Install it now from within Stata by typing
In der letzten Woche ist meine Einführung zum Thema Strukturgleichungsmodelle bei Springer/VS erschienen. Das Buch zeigt, wie sich die gängigsten Modelle (u.a. einfache und Mehr-Gruppen-Konfirmatorische-Faktorenanalysen (CFA/MGCFA)) in Stata, Lisrel und MPlus realisieren lassen. Die Beispiele stammen aus dem Bereich der politikwissenschaftlichen Einstellungsforschung (Fremdenfeindlichkeit, politische Entfremdung, politisches Interesse …).
We have updated our add-on (or ado) surveybias, which calculates our multinomial generalisation of the old Martin, Traugott, and Kennedy (2005) measure for survey bias. If you have any dichotomous or multinomial variable in your survey whose true distribution is known (e.g. from the census, electoral counts, or other official data), surveybias can tell you just how badly damaged your sample really is with respect to that variable. Our software makes it trivially easy to asses bias in any survey.
Within Stata, you can install/update surveybias by entering ssc install surveybias. We’ve also created a separate page with more information on how to use surveybias, including a number of worked examples.
The new version is called 1.3b (please don’t ask). New features and improvements include:
Support for (some) complex variance estimators including Stata’s survey estimator (sample points, strata, survey weights etc.)
Improvements to the numerical approximation. survebias is roughly seven times faster now
A new analytical method for simple random samples that is even faster
Convenience options for naming variables created by survebiasseries
Lots of bug fixes and improvements to the code
If you need to quantify survey bias, give it a spin.
Contrary to popular belief, it’s not always the third reviewer that gives you grief. In our case, it is the one and only reviewer that shot down a manuscript, because at the very least, s/he would have expected (and I quote) an “analytical derivation of the estimator”. For some odd reason of his own, the editor, instead of simply rejecting us, dared us to do just that, and against all odds, we succeeded after some months of gently banging various heads against assorted walls.
Needless to say that on second thought, the reviewer found the derivation “interesting but unnecessarily complicated” and now recommends relegating the material to a footnote. To make up for this, s/he delved into the code of our software, spotted some glaring mistakes and recommended a few changes (actually sending us a dozen lines of code) that result in a speed gain of some 600 per cent. This is very cool, very good news for end users, very embarrassing for us, and generally wrong on so many levels.
While the interwebs are awash with headline findings from countless surveys, commercial companies (and even some academics) are reluctant to make their raw data available for secondary analysis. But fear not: Quite often, media outlets and aggregator sites publish survey margins, and that is all the information you need. It’s as easy as .
The Solution: surveybiasi
After installing our surveybias add-on for Stata, you will have access to surveybiasi. surveybiasi is an “immediate command” (Stata parlance) that compares the distribution of a categorical variable in a survey to its true distribution in the population. Both distributions need to be specified via the popvalues() and samplevalues() options, respectively. The elements of these two lists may be specified in terms of counts, of percentages, or of relative frequencies, as the list is internally rescaled so that its elements sum up to unity. surveybiasi will happily report k s, and (check out our paper for more information on these multinomial measures of bias) for variables with 2 to 12 discrete categories.
Bias in a 2012 CBS/NYT Poll
A week before the 2012 election for the US House of Representatives, 563 likely voters were polled for CBS/The New York Times. 46 per cent said they would vote for the Republican candidate in their district, 48 per cent said they would vote for the Democratic candidate. Three per cent said it would depend, and another two per cent said they were unsure, or refused to answer the question. In the example these five per cent are treated as “other”. Due to rounding error, the numbers do not exactly add up to 100, but surveybiasi takes care of the necessary rescaling.
In the actual election, the Republicans won 47.6 and the Democrats 48.8 per cent of the popular vote, with the rest going to third-party candidates. To see if these differences are significant, run surveybiasi like this:
Given the small sample size and the close match between survey and electoral counts, it is not surprising that there is no evidence for statistically or substantively significant bias in this poll.
An alternative approach is to follow Martin, Traugott and Kennedy (2005) and ignore third-party voters, undecided respondents, and refusals. This requires minimal adjustments: is now 535 as the analytical sample size is reduced by five per cent, while the figures representing the “other” category can simply be dropped. Again, surveybiasiinternally rescales the values accordingly:
Under this two-party scenario, is identical to Martin, Traugott, and Kennedy’s original (and all other estimates are identical to ‘s absolute value). Its negative sign points to the (tiny) anti-Republican bias in this poll, which is of course even less significant than in the previous example.
The accuracy of pre-election surveys is a matter of considerable debate. Obviously, any rigorous discussion of bias in opinion polls requires a scalar measure of survey accuracy. Martin, Traugott, and Kennedy (2005) propose such a measure for the two-party case, and in our own work (Arzheimer/Evans 2014), Jocelyn Evans and I demonstrate how can be generalised to the multi-party case, giving rise to a new measure (seriously) and some friends and :
In this article, we propose a polling accuracy measure for multi-party elections based on a generalization of Martin, Traugott, and Kennedy s two-party predictive accuracy index. Treating polls as random samples of a voting population, we first estimate an intercept only multinomial logit model to provide proportionate odds measures of each party s share of the vote, and thereby both unweighted and weighted averages of these values as a summary index for poll accuracy. We then propose measures for significance testing, and run a series of simulations to assess possible bias from the resulting folded normal distribution across different sample sizes, finding that bias is small even for polls with small samples. We apply our measure to the 2012 French presidential election polls to demonstrate its applicability in tracking overall polling performance across time and polling organizations. Finally, we demonstrate the practical value of our measure by using it as a dependent variable in an explanatory model of polling accuracy, testing the different possible sources of bias in the French data.
@Article{arzheimer-evans-2013,
author = {Arzheimer, Kai and Evans, Jocelyn},
title = {A New Multinomial Accuracy Measure for Polling Bias },
journal = {Political Analysis},
year = 2014,
abstract = {In this article, we propose a polling accuracy measure for
multi-party elections based on a generalization of Martin,
Traugott, and Kennedy s two-party predictive accuracy index.
Treating polls as random samples of a voting population, we first
estimate an intercept only multinomial logit model to provide
proportionate odds measures of each party s share of the vote, and
thereby both unweighted and weighted averages of these values as a
summary index for poll accuracy. We then propose measures for
significance testing, and run a series of simulations to assess
possible bias from the resulting folded normal distribution across
different sample sizes, finding that bias is small even for polls
with small samples. We apply our measure to the 2012 French
presidential election polls to demonstrate its applicability in
tracking overall polling performance across time and polling
organizations. Finally, we demonstrate the practical value of our
measure by using it as a dependent variable in an explanatory model
of polling accuracy, testing the different possible sources of bias
in the French data.},
keywords = {meth-e},
volume = {22},
number = {1},
pages = {31--44},
url =
{http://pan.oxfordjournals.org/cgi/reprint/mpt012?ijkey=z9z740VU1fZp331&keytype=ref},
doi = {10.1093/pan/mpt012},
data = {http://hdl.handle.net/1902.1/21603},
html =
{https://www.kai-arzheimer.com/new-multinomial-accuracy-measure-for-polling-bias}
}
The Surveybias Software 1.1
Calculating the accuracy measures is a matter of some algebra. Estimating standard errors is a bit trickier but could be done manually by making use of the relationship between and the multinomial logistic model on the one hand and Stata’s very powerful implementation of the Delta method on the other. But these calculations are error-prone and become tedious rather quickly. This is why we created a suite of user written programs (surveybias, surveybiasi, and surveybiasseries). They do all the necessary legwork and return the estimates of accuracy, complete with standard errors and statistical tests.
We have just updated our software. The new version 1.1 of surveybias features some bug fixes, a better mechanism for automagically dealing with convergence problems, better documentation, and a new example data set that compiles information on 152 German pre-election polls conducted between January and September 2013.
Examples, Please?
surveybias comes with example data from the French presidential election 2012 and the German parliamentary election 2013. From within Stata, type help surveybias, help surveybiasi, and help surveybiasseries to see how you can make use of our software. If I can find the time, I will illustrate the use of surveybias in a mini series of blogs over the next week.
Updating Surveybias
The new version 1.1 should appear is now on SSC within the next couple of days or so, but the truly impatient can get it now. In your internet-aware copy of Stata (version 11 or later), type