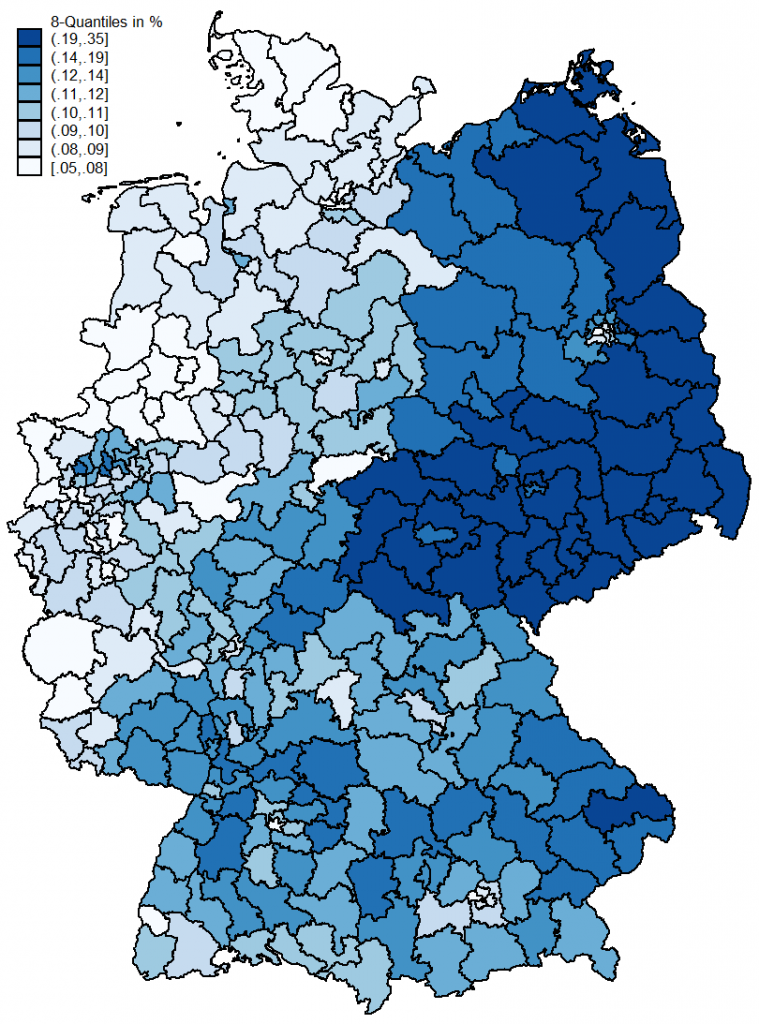
As (West) European election years go, 2017 was quite something. The French party system changed beyond recognition. The radical right entered Germany’s national parliament for the first time. UKIP was wiped out, but May still managed to lose a comfortable majority. And very high fragmentation resulted in a coalition that looks improbable even by Dutch standards.
SCoRE is our multinational project that explores the link between local and regional living conditions on the one hand and radical right attitudes and behaviours in these four countries on the other. Sometimes, serendipity is really a thing. Because we had our individual-level data collection scheduled for this year anyway, we gained some unique insights into all four big Western European elections of 2017.
- Arzheimer, Kai and Theresa Bernemann. “‘Place’ Does Matter for Populist Radical Right Sentiment, but How? Evidence from Germany.” European Political Science Review 16.2 (2024): 167-186. doi:10.1017/S1755773923000279
[BibTeX] [Abstract] [HTML]The notion of ‘place’ has become a central concern in research on the populist radical right (PRR), but scholars seem to have different things in mind when talking about how geography affects individual political attitudes. In our paper, we therefore aim to structure the debate on the impact of place and to understand exactly how place affects PRR attitudes (nativism, right-wing authoritarianism, and populism). Conceptually, we identify four potentially relevant aspects of ‘place’ that underpin much of the current literature: place-related attitudes (localism and resentment), place-specific living conditions, socio-demographic composition, and characteristics unique to a particular place, i.e., its local history and culture. We also discuss how these aspects are related and how they may interact. Empirically, we assess the relative importance of these four aspects of place for PRR sentiment in Germany, a country that is particularly well suited to this type of analysis. Using fine-grained geocoded survey data collected prior to the 2017 election, we find that (1) there is considerable spatial variation and clustering in PRR attitudes, (2) a place’s socio-demographic composition and (3) place resentment account for much of this, while (4) localism has weaker effects. We find (5) no relevant interaction between localism and place resentment, (6) no substantial evidence that mediation through place-related attitudes leads to an underestimation of the other aspects, and (7) no evidence for effects of the unique culture or history of the places we studied. Moreover, (8) location in the former GDR still has a substantial impact, whereas (9) other place-specific conditions (deprivation, demographic decline, migration, rurality) that could be addressed by policy interventions have no or rather weak effects. We conclude that PRR sentiment in ‘places that don’t matter’ results also, though by no means exclusively, from a lack of recognition.
@Article{arzheimer-bernemann-2023,
author = {Arzheimer, Kai and Bernemann, Theresa},
title = {'Place' Does Matter for Populist Radical Right Sentiment, but How?
Evidence from Germany},
journal = {European Political Science Review},
year = 2024,
volume = {16},
number = {2},
pages = {167-186},
abstract = {The notion of 'place' has become a central concern in research on
the populist radical right (PRR), but scholars seem to have
different things in mind when talking about how geography affects
individual political attitudes. In our paper, we therefore aim to
structure the debate on the impact of place and to understand
exactly how place affects PRR attitudes (nativism, right-wing
authoritarianism, and populism). Conceptually, we identify four
potentially relevant aspects of 'place' that underpin much of the
current literature: place-related attitudes (localism and
resentment), place-specific living conditions, socio-demographic
composition, and characteristics unique to a particular place,
i.e., its local history and culture. We also discuss how these
aspects are related and how they may interact. Empirically, we
assess the relative importance of these four aspects of place for
PRR sentiment in Germany, a country that is particularly well
suited to this type of analysis. Using fine-grained geocoded survey
data collected prior to the 2017 election, we find that (1) there
is considerable spatial variation and clustering in PRR attitudes,
(2) a place's socio-demographic composition and (3) place
resentment account for much of this, while (4) localism has weaker
effects. We find (5) no relevant interaction between localism and
place resentment, (6) no substantial evidence that mediation
through place-related attitudes leads to an underestimation of the
other aspects, and (7) no evidence for effects of the unique
culture or history of the places we studied. Moreover, (8) location
in the former GDR still has a substantial impact, whereas (9) other
place-specific conditions (deprivation, demographic decline,
migration, rurality) that could be addressed by policy
interventions have no or rather weak effects. We conclude that PRR
sentiment in 'places that don't matter' results also, though by no
means exclusively, from a lack of recognition.},
html = {https://www.cambridge.org/core/journals/european-political-science-review/article/place-does-matter-for-populist-radical-right-sentiment-but-how-evidence-from-germany/7C639AAC5F6B1BC2F6324F7D57136827},
pdf = {https://www.cambridge.org/core/services/aop-cambridge-core/content/view/7C639AAC5F6B1BC2F6324F7D57136827/S1755773923000279a.pdf/place-does-matter-for-populist-radical-right-sentiment-but-how-evidence-from-germany.pdf},
doi = {10.1017/S1755773923000279}
}
Accordingly, my colleagues have written up reports for France, Germany, the Netherlands, and the UK, complete with beautiful maps. Who does not like maps?
But perhaps you’re pressed for time or not sure if you really want to read four (fairly short) reports? With the European Parliamentary elections on the horizon, I made a short explainer/teaser video about them to bring you up to speed in just over two minutes. I have a hunch that afterwards, you will want to read all four pieces.
