Stata Software for Assessing Survey Bias

BinaryApe / Foter / CC BYIn a recent paper, we derive various multinomial measures of bias in public opinion surveys (e.g. pre-election polls). Put differently, with our methodology, you may calculate a scalar measure of survey bias in multi-party elections. Thanks to Kit Baum over at Boston College, our Stata add-on surveybias.ado is now available…
Creating Matrix-Like Plots in Stata

Matrix Graph in Stata

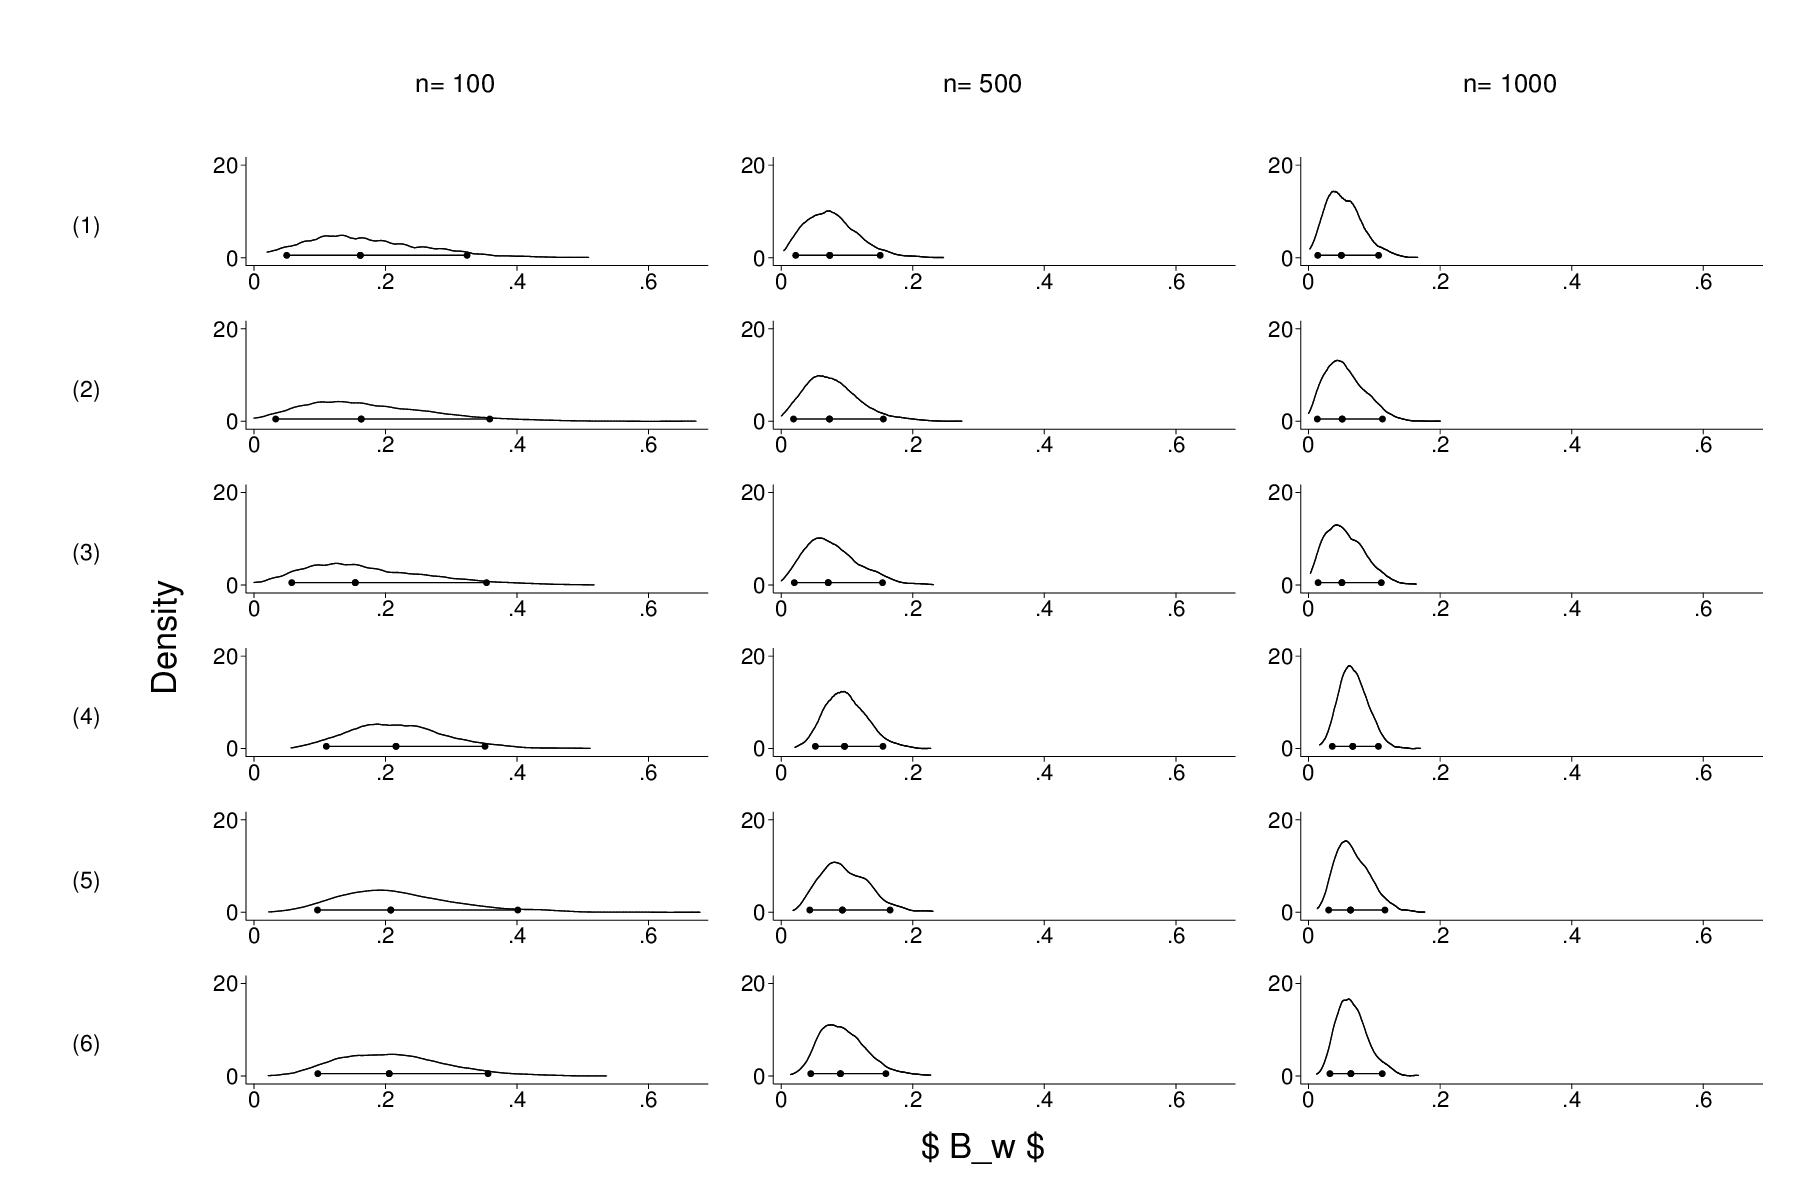
I could find no canned command that produces what I wanted: a table-like arrangement, with labels for the columns (i.e. sample sizes) and rows (experimental conditions). What I could do was set up / label a variable with 18 categories (one for each data set) and use the ,by() option to create a trellis plot. But that would waste a lot of ink/space by replicating redundant information. At the end of the day, I created a nine graphs that were completely empty save for the text that I wanted as row/column labels, which I then combined into two separate figures, that were then combined (using a distorted aspect ratio) with my 18 separate plots. That boils down to a lot of dumb code.

Are Germans More Afraid of Neo-Nazis Than of Islamists?

Who is afraid of whom? The liberal German weekly Zeit has commissioned a YouGov poll which demonstrates that Germans are more afraid of right-wing terrorists than of Islamist terrorists. The question read “What is, in your opinion, the biggest terrorist threat in Germany?” On offer were right-wingers (41 per cent), Islamists (36.6 per cent), left-wingers…

Sampling from a Multinomial Distribution in Stata

Sometimes, a man’s gotta do what a man’s gotta do. Which, in my case, might be a little simulation of a random process involving an unordered categorical variable. In R, sampling from a multinomial distribution is trivial. rmultinom(1,1000,c(.1,.7,.2,.1)) gives me a vector of random numbers from a multinomial distribution with outcomes 1, 2, 3, and…