Back in the mist of time, when I should have been was working on my PhD, I found a blue book on the shelf that a previous occupant of the office had left there. As I learned later, it was The Blue Book that introduced the S language, the predecessor of R. I got sidetracked (as you do) and taught myself how to produce beautiful graphs in what is now known as base R, and how to run poorly understood time series analyses (impossible in SPSS at this point).
A little later, I got hooked on Stata, and to the present day, I refuse to be Stata-shamed, as Ben Stanley put it. 95 per cent of the time, it does the job, and quickly so. Also, the documentation is simply excellent.
But every now and then, I came back to R because I needed something specific. And it was mostly fun. Having access to all these APIs (in fact, concurrently having more than one data set in memory) was exciting. Having a real, reasonably straightforward scripting /programming language at my disposal instead of Stata’s hodgepodge of three (four if you count the graph language) half-baked syntaxes was exhilarating. Having a go at the latest methods on the basis of nothing more than skimming a working paper (skipping every non-trivial equation) was… I guess a little bit like trimming your hair with a chainsaw.
But finding, installing, updating and then loading three packages, just to make recoding a little more intuitive? Seriously, R? Not so cool. In fact, finding a variable (whose name and data set must be given in full) was usually enough to reduce me to tears. Attach() somehow never does what I think it should do. And so, I would return to Stata once more, like <insert awkward metaphor>.
Then, during one of my last forays, I began playing with the tidyverse. And as the young ones are prone to say: my mind was blown. Tibbles! Pipelines! Lots of yummie helper functions! Going from long to wide format and back (in various different ways)! Grouping, summarising, and even some pythonesque list traversing. This was no longer the fascinating but slightly stroppy R I used to know.
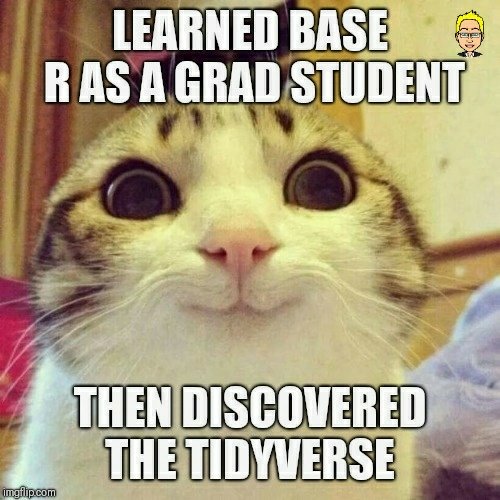
Compared to the handful of letters and abbreviations that I use in Stata to get things done, recoding-wise, this is still quite verbose, and I have to look up just about everything. But I really like it. Like, really like it. And so doing more stuff in R is firmly on the endless List Of Things I Want To Look Into. To end on the most positive note possible, here is a gratuitous picture of a cat.


Your Stata vs R experience is so similar to mine. But now this seems to mean I should go and try tidyverse 😬 which I have been avoiding !
The tidyverse is great in ways S and base R aren’t (pls always distinguish a singleton set from an element kthx) but painfully slow as your data grows. It’s useful also to learn data.table with its mystifyingly compact syntax.
RT @sabrinajmayer: I simply love Stata (come on, [re]coding variables is sooo fast! and using plottig by @DanBischof makes my graphs looks…
RT @kai_arzheimer: How the tidyverse changed my view of #rstats – kai arzheimer https://t.co/sRHaTYJfIv https://t.co/wKex21qw5J